基于Plotlab的数字荧光显示模块的设计与实现毕业论文
2020-05-21 22:19:24
摘 要
在现代错综复杂的电磁场中,电磁信号的复杂性不断变大,加上信号密度不断增加,导致信号的突发性也发生了改变,信号所处频段也进一步的拓展。由于频段的拥挤,有些有用的信号往往会隐藏在密集的电磁环境中,因此必须采用有效的方法对这些信号进行采集和分析。在早期频谱分析仪是以扫频的方式显示信号的,而且所测量的频段也很窄。直到后来出现了采用合成本振技术的新型频谱分析仪,所能测量的频率范围在100Hz-22GHz,分辨率带宽的测量也达到10Hz。但是随着微电子技术、集成电路、计算机技术的发展,频谱分析仪在工业和通信测量等方面都有了广泛的应用,向着高性能、宽频带、数字化、模块化、高灵敏度、大动态范围等方向进步。在频谱信号的监测和采集中,对瞬时信号频谱的采集与定位一直是技术难题。因此需要一种能够更直观的显示在不同时间内处于同一频率范围内的多个信号,并且可以突出显示各信号的多种不同信息,大大提高设备对信号的捕获和观察能力,适合在雷达信号侦察中应用[2]提高设备对信号的捕获和观察能力的频谱监测和分析的技术方法。
频谱分析中的数字荧光显示技术解决了上述的问题。实时频谱中的数字荧光技术(DPX)是频谱分析中一项重要的技术,它可以解决传统频谱分析仪和矢量信号分析仪的监测中对信号细节缺失的问题。相对比传统频谱分析技术,DPX频谱图不仅能够检测到信号的发生,还能够更直观的显示在不同时间内处于同一频率范围内的多个信号,并利用信号强度等级、配色方案[1]和图像统计等数字图像增强技术来突出信号映射出的多种信息,生成实时频谱的态势图。通过研究DPX的基本技术,实现原理,并且从理论方面研究一种低复杂度的DPX实现算法,配合实时频谱仪的硬件,设计一个可以显示DPX三维频谱图的软件。
本文介绍了实时频谱分析中DPX技术算法的研究与应用的整个过程。以visual studio作为其开发环境,用C#语言编写代码。为了提高频谱分析的采集效率,在开发应用中采用了以.cs框架,分别设计了实时扫频频谱分析窗口、频谱瀑布图窗口以及频谱DPX显示窗口。
本设计实现了在信号采集的频谱分析图中显示了在不同时间内处于同一频率范围内的多个信号,并利用信号强度等级、配色方案[1]和图像统计等数字图像增强技术来突出信号映射出的多种信息,生成一段时间内的实时频谱态势三维信息图。
关键字:频谱分析 DPX技术 信号采集 配色方案
Based on Plotlab 's design and implementation of digital fluorescent display module
Abstract
In the modern complex electromagnetic field, the complexity of the electromagnetic signal becomes larger and larger, with increasing signal density, leading to sudden signal is also changed, which the band also signal further expansion.Since the band's crowded, some useful signal is often hidden in dense electromagnetic environments, and must use an effective method of collecting and analyzing these signals.In the early swept spectrum analyzer is a way to display the signal, and the measured frequency is also very narrow. Until then appeared synthetic local oscillator technology, the new spectrum analyzer can be measured in the frequency range 100Hz-22GHz, measurement resolution bandwidth has reached 10Hz. But with the development of microelectronics, integrated circuits, computer technology, spectrum analyzers and communication in the industrial measurement it has been widely used toward high-performance, broadband, digital, modular, high sensitivity, large dynamic range such as the direction and progress. Monitoring and collection of spectrum signals, the instantaneous signal spectrum acquisition and positioning have been technical problems. Therefore a need for a more intuitive display in multiple signals in the same frequency range at different times, and may highlight a variety of different information of each signal, greatly improve the device signal capture and observation capability, suitable for use in radar signal reconnaissance applications [2] improve equipment technical methods for capturing and observation signal spectrum monitoring and analysis.
Spectrum analysis of digital phosphor display technology to solve the above problems. Real-time fluorescence spectrum of digital technology (DPX) is a spectrum analysis is an important technology that can solve the traditional spectrum analyzers and vector signal analyzer to monitor the problem of the lack of signal detail. Relatively than traditional spectrum analysis techniques, DPX spectrum not only able to detect the occurrence of the signal, but also more intuitive display in multiple signals in the same frequency range at different times, and using the signal strength level, color scheme [1] and image statistics and other digital image enhancement technology to highlight the signals are mapped out a variety of information, generate real-time spectrum situation map. By studying the basic DPX technology, theory, and research from a low complexity theory DPX algorithm, with real-time spectrum analyzer hardware, design a three-dimensional display DPX spectrum of software.
This article describes the real-time spectrum analysis of the entire process research and application of DPX technology algorithms. In visual studio as their development environment to write code in C #. In order to improve the collection efficiency of spectrum analysis, application development framework used to .cs were designed swept spectrum analysis in real-time window spectrum waterfall window and DPX spectrum display window.
This design shows a plurality of signals in the same frequency range at different times, and using the signal strength level, color scheme and image statistics and other digital image enhancement technology to highlight the signal spectrum analysis diagram of signal acquisition mapping out a variety of information, generate real-time three-dimensional spectral information map situation over time.
Keywords: Spectrum analysis;DPX technology;signal acquisition;the color scheme
目录
摘要 II
Based on Plotlab 's design and implementation of digital fluorescent display module III
Abstract III
第一章 绪论 7
1.1 引言 7
1.2 课题研究的背景 7
1.3 课题的研究现状 8
1.4 本文的工作 8
1.5 论文的结构 9
第二章 需求分析 10
2.1可行性分析 10
2.1.1 经济可行性 10
2.1.2 技术可行性 10
2.1.3 运行可行性 10
2.2功能性需求分析 10
2.2.1射频信号源的功能需求 11
2.2.2 频谱DPX显示模块功能需求 11
2.2.3 外设实时频谱仪硬件的功能需求 11
2.3 其它需求分析 11
2.3.1安全性需求 11
第三章 数字荧光显示模块的设计概要 12
3.1 系统整体设计 12
3.1.1 射频信号产生模块的开发 13
3.1.2 频谱DPX显示模块的开发 14
3.2 射频信号产生模块的设计 16
3.2.1 射频信号产生模块设计目标 16
3.2.2 射频信号的组成 16
3.3 频谱DPX显示模块的设计 16
3.3.1 位图数据库 17
3.3.2 映色算法 17
3.3.3 RGB三原色的伪彩色编码 17
3.3.4 二进制数取位法(TBFBN) 18
3.3.5 二进制数取位法的取位和组合方法 19
3.4 频谱分析硬件SAD250M-NET的说明 19
第四章 数字荧光显示模块的实现 20
4.1 射频信号产生模块 20
4.1.1 射频信号模块的程序代码 20
4.2 频谱DPX显示模块 23
4.2.1 频谱信号荧光的染色方案 23
4.2.2 DPX技术对信号采集的统计方案 24
4.2.3 DPX频谱图的绘制方案 24
4.3 频谱分析硬件模块 26
第五章 系统测试 28
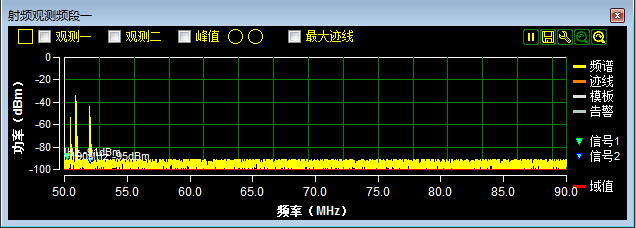
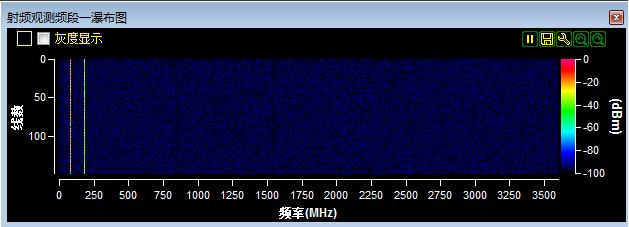
5.1 射频信号产生系统的测试 28
5.2数字荧光显示功能的测试 28
第六章 总结及展望 31
6.1 总结评价 31
6.2 展望 31
参考文献 33
绪论
引言
近年来,伴随着无线技术数字化、智能化的迅猛发展,高速跳频、扩频、时分复用、复杂调制等各种新技术得到越来越广泛的应用。与此同时,各种低截获概率信号日益增多,利用传统技术手段进行无线电信号监测面临诸多,而DPX数字荧光频谱技术正是解决这些监测难题的强有力的手段。
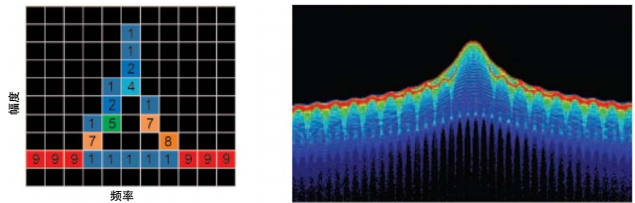
DPX数字荧光频谱技术有一下特点:(1)DPX频谱显示了在不同时间共享相同频率的多个信号,而不只是显示最大信号、最小信号或平均电信号;(2)高变换速率进行频谱测量的检测;(3)采用统计现轨迹和超快速频谱更新,实现高倾听概率(POI)。
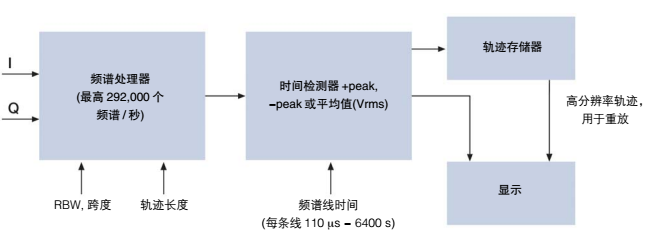
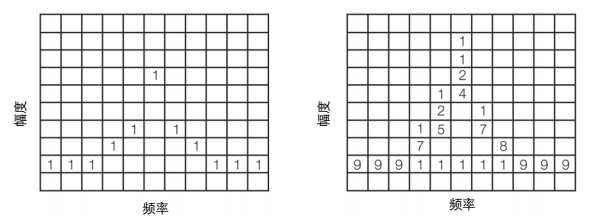
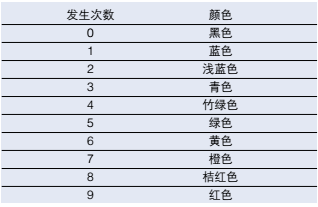
数字荧光显示模块的实现通过对信号采集统计,每秒执行数万次频谱测量,讲频谱以全速写入位图(bitmap)数据库中,然后以看得到的速率传送到屏幕上,经过彩色编码的方法,实现数据的可视化,得到一张三维信息的频谱图。频谱图包含了这段时间内频率、幅度和命中次数的三维信息。
1.2 课题研究的背景
随着通信技术日新月异,应用于无线信号通信的编码、调制技术不断改进,对不同强度频率的信号细节分析有更高的要求,朝着智能化、数字化、高效化三个重要方向发展。
相关图片展示: