聊城市低温预报方法研究外文翻译资料
2022-12-19 17:39:02
Meteorology and Atmospheric Physics
January 2011, Volume 110, Issue 3–4, pp 143–149
Estimation of the monthly and annual mean maximum and mean minimum air temperature values in Greece
- M. A. Gouvas
- N. K. Sakellariou
- H. D. Kambezidis
Abstract
In this study, regression equations to estimate the monthly and annual values of the mean maximum and mean minimum air temperatures in Greece are derived. For this purpose, data from 87 meteorological stations distributed all over Greece are used. Geographical parameters, i.e., altitude, latitude, longitude, minimum distance from the sea and an index of terrain morphology, are used as independent variables. These equations explain 79–97% of the variance of the temperature values and have standard error of estimate between 0.59 and 1.20°C. Data from 37 other meteorological stations are used to validate the accuracy of the equations. Topographic or climatic factors, which could not be introduced into the equations, are responsible for most temperature residuals gt;0.5°C or lt;minus;0.5°C. Moreover, some particular emphasis has been given to the values of the regression coefficient for the altitude, since it is the estimator for the mean lapse rate of air temperature.
Keywords
Wind Speed Lapse Rate Cold Period Prevailing Wind Temperature Time Series
These keywords were added by machine and not by the authors. This process is experimental and the keywords may be updated as the learning algorithm improves.
1 Introduction
The mean maximum and mean minimum air temperatures are two of the most important climatological variables, useful for various ecological, agricultural and other applications. They are especially necessary for the Embergerrsquo;s bioclimatic classification (Nahal 1981) widely used by foresters and biologists. Further elaboration of the data used in this study shows that the monthly mean minimum air temperature is well correlated with the mean number of frosty days in Greece (e.g. for January R = minus;0.94 and for February R = minus;0.93), so they are important for the plants life.
A major community of scientists (agricultural meteorologists, foresters, climatologists) needs to have spatial values of mean maximum and mean minimum air temperature over an area for their studies. This is usually not feasible due to the small number of meteorological stations at altitudes higher than 500 m a.m.s.l. For this purpose, the mean lapse rate of mean maximum and mean minimum air temperatures given by Makris (1954) can be used for Greece. Nevertheless, these values considerably differ among the various regions in the country; the complex terrain as well as the complicated coastline makes this task difficult or even impossible. These difficulties can partly be overcome by using multiple regression analysis, a tool used by Flocas et al. (1983) for the estimation of mean monthly air temperatures over Greece. Along the same line, Zheng and Basher (1996) have worked on temperature data in New Zealand area, while Saacute;nchez Palomares et al. (1999) on temperature and precipitation data in Spain.
The main aim of the present study is to derive regression equations that are able to estimate mean maximum and mean minimum air temperatures in Greece, using simple topographic elements. A secondary aim is to derive estimations of the mean lapse rate of maximum and minimum temperature, in order to perform reductions of the temperature at any altitude.
2 Data and analysis methods
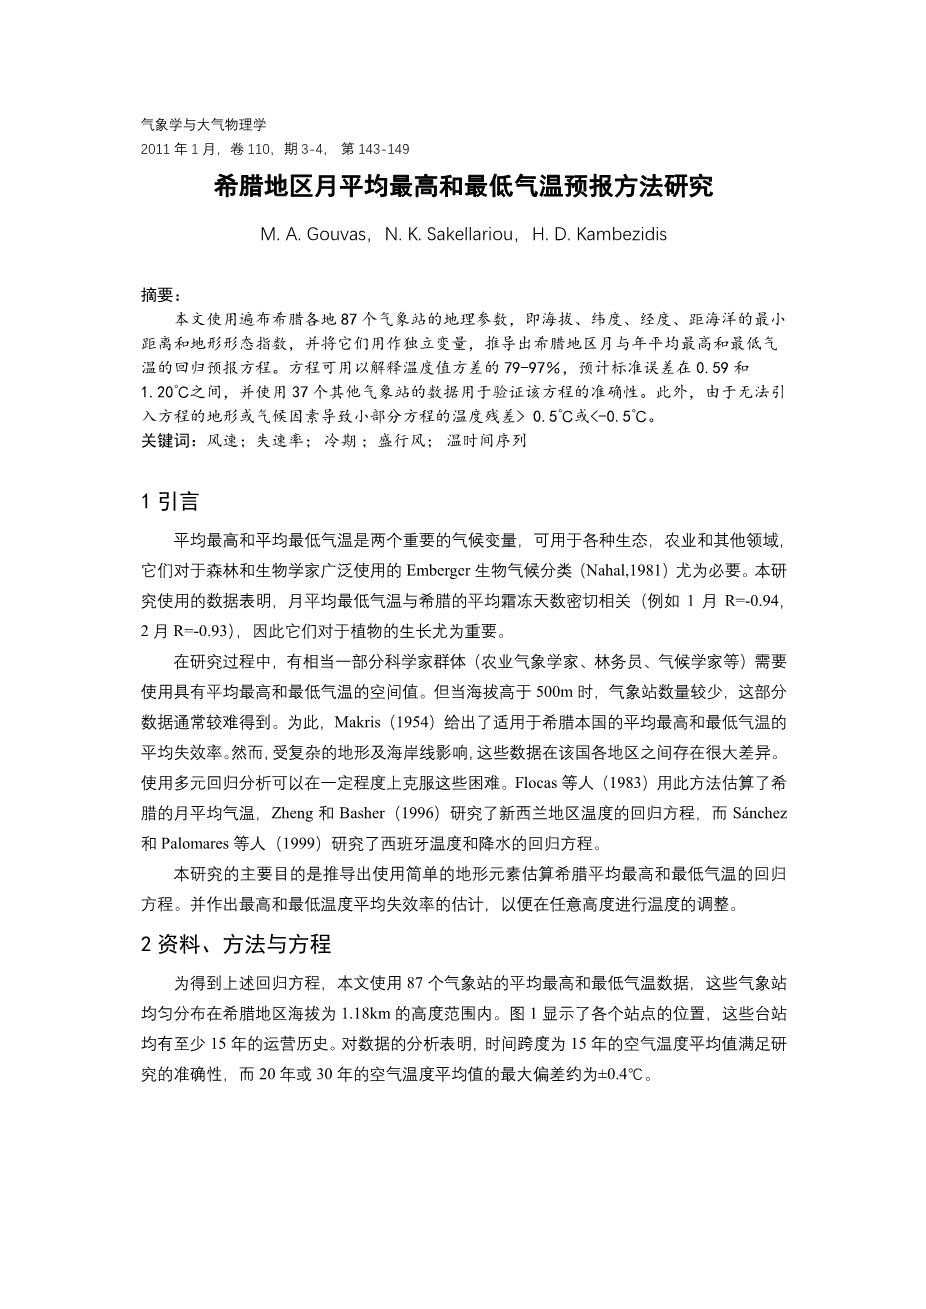
To derive the above-mentioned regression equations, mean maximum and mean minimum air temperature data from 87 meteorological stations, uniformly distributed over Greece in an altitude range from sea level to 1,180 m a.m.s.l. have been used. Figure 1 shows the location of the stations. The stations were chosen as being in operation for at least 15 years. An analysis of data from some of the stations (not presented here) showed that a 15-year air temperature average satisfies the accuracy of the study, since the maximum deviation from a 20- or 30-year air temperature average is about plusmn;0.4°C.
Fig. 1
Locations of the 87 stations used for the extraction of the equations, classified into 5 groups according to their altitude
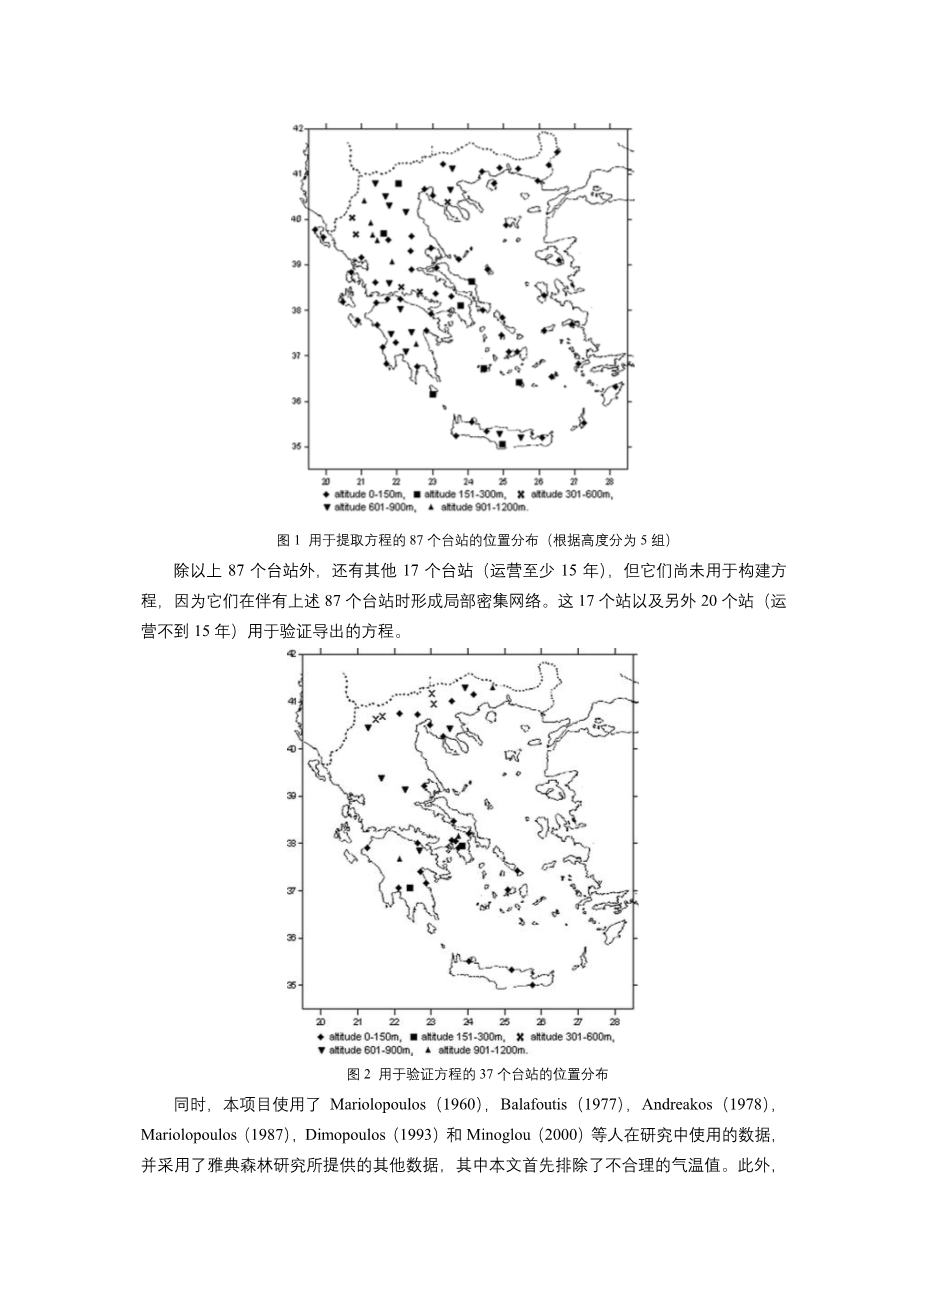
Apart from the 87 stations, other 17 stations (operated for at least 15 years) exist, but they have not been used for the equations, since they form a locally dense network when accompanied by the above-mentioned 87 stations. These 17 stations as well as 20 others (operated for less than 15 years) are used for the validation of the derived equations; they are shown in Fig. 2.
Fig. 2
Similar to Fig. 1, but of the 37 stations used
剩余内容已隐藏,支付完成后下载完整资料
英语译文共 9 页,剩余内容已隐藏,支付完成后下载完整资料
资料编号:[19830],资料为PDF文档或Word文档,PDF文档可免费转换为Word


